
Dartfish Software 2026 Update 2 makes the Report pane interactive: filter and sort a view, open the events behind a number, choose colors and totals, and map positions with the new Zone Map view.
Purpose and Scope
A report summarizes the tagged events in tables and charts. With Update 2, each number leads back to its events, each view can be narrowed to the values that matter, and a new view type, the Zone Map, shows where the actions took place. This article covers these tools on an existing report. The screenshots show a tennis match; the same steps apply to any sport.
What you can do
- Keep only the main values of a table or a chart, sorted by name or by total
- Click a number to list the events behind it, then add them to a montage or run an action rule on them
- Choose the color of each series and how the totals of a table are counted
- Map the positions tagged with a Zone Tool and select an area of the map
Requirements
- You must have myDartfish 360S or above.
- Open the Report pane (Ctrl+Shift+R) in the Live or Replay workspace, with a tagging panel open.
- You need a report with at least one view. To build one, click Edit, drag keyword categories to Rows and Columns, choose a View Type, then click Save Report.
- For the Zone Map: a Zone Tool in the tagging panel, with a Coordinates Category so that it records positions.
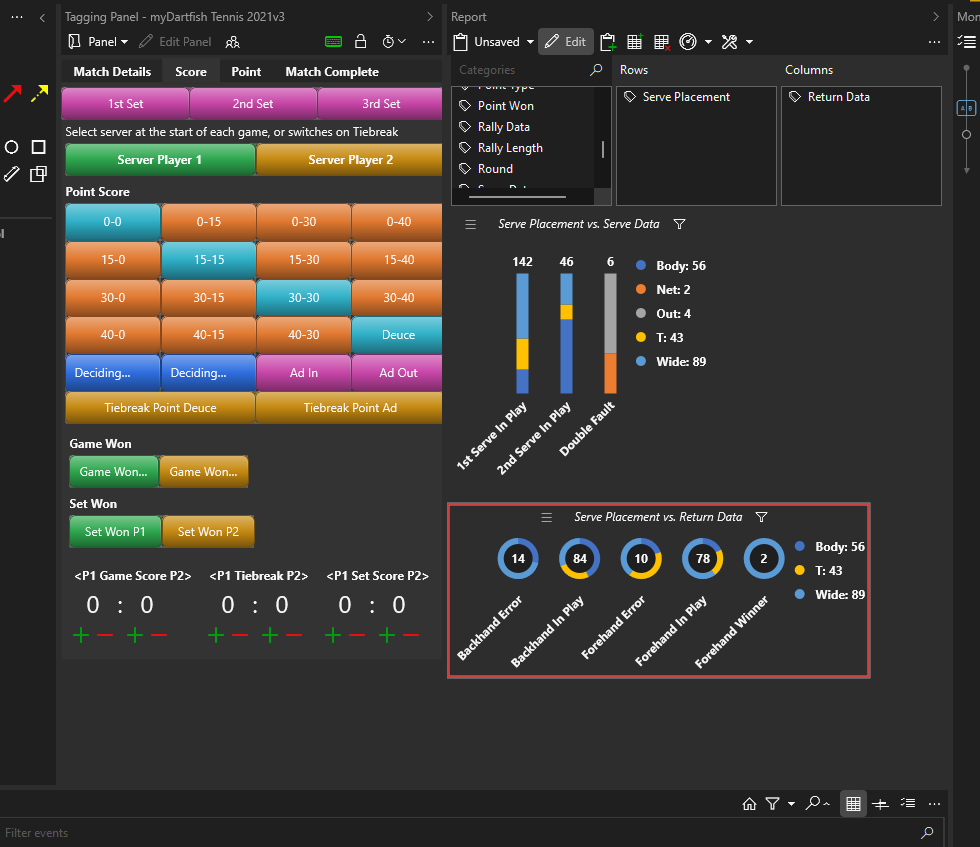
Step-by-step guide
1. Keep only the main values of a view
- Click the Filter and Sort button next to the view label. The popup has one section per axis (rows and columns).
- Choose what to keep:
- A to Z, Z to A, Largest First or Smallest First: the order of the values, by name or by total
- Show First: keeps only the first values in that order, from 1 to 10 (All by default)
- Value check boxes: an unchecked value disappears from the view
- Reset All: shows all the values again in the default order
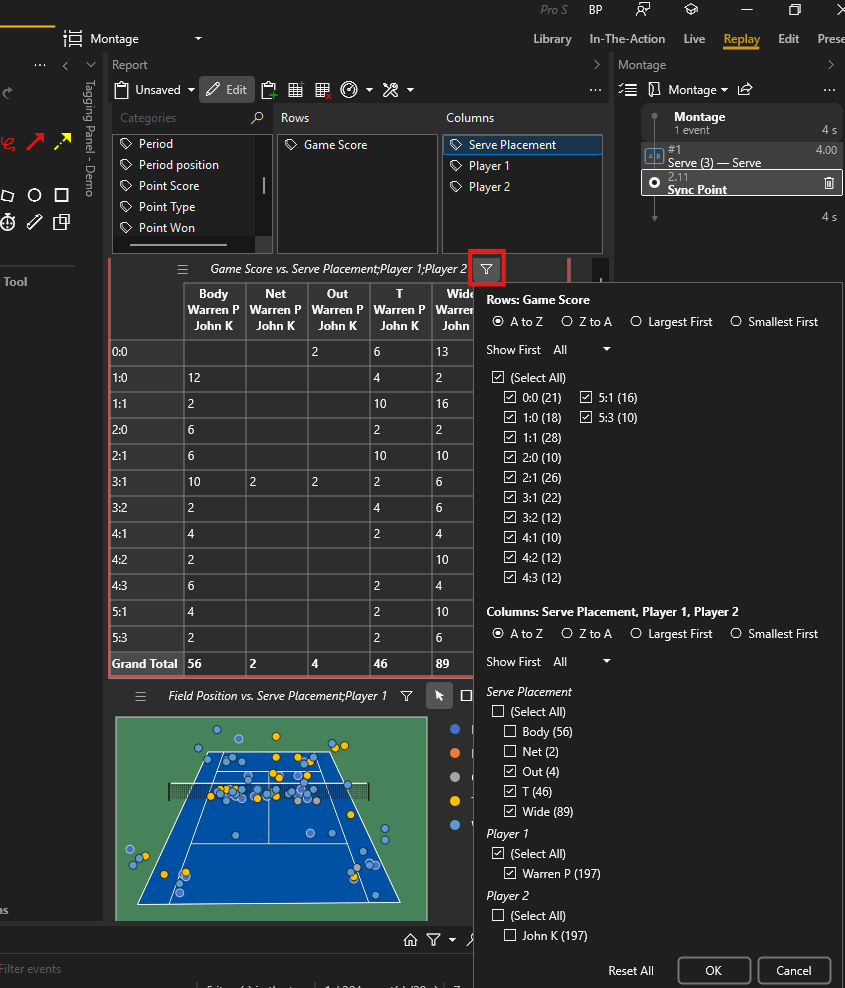
Result: the view shows only the values you kept. For example, on a table with one row per player, Largest First and Show First 5 keep the five players with the most events, from the highest count down.
2. Find and use the events behind a number
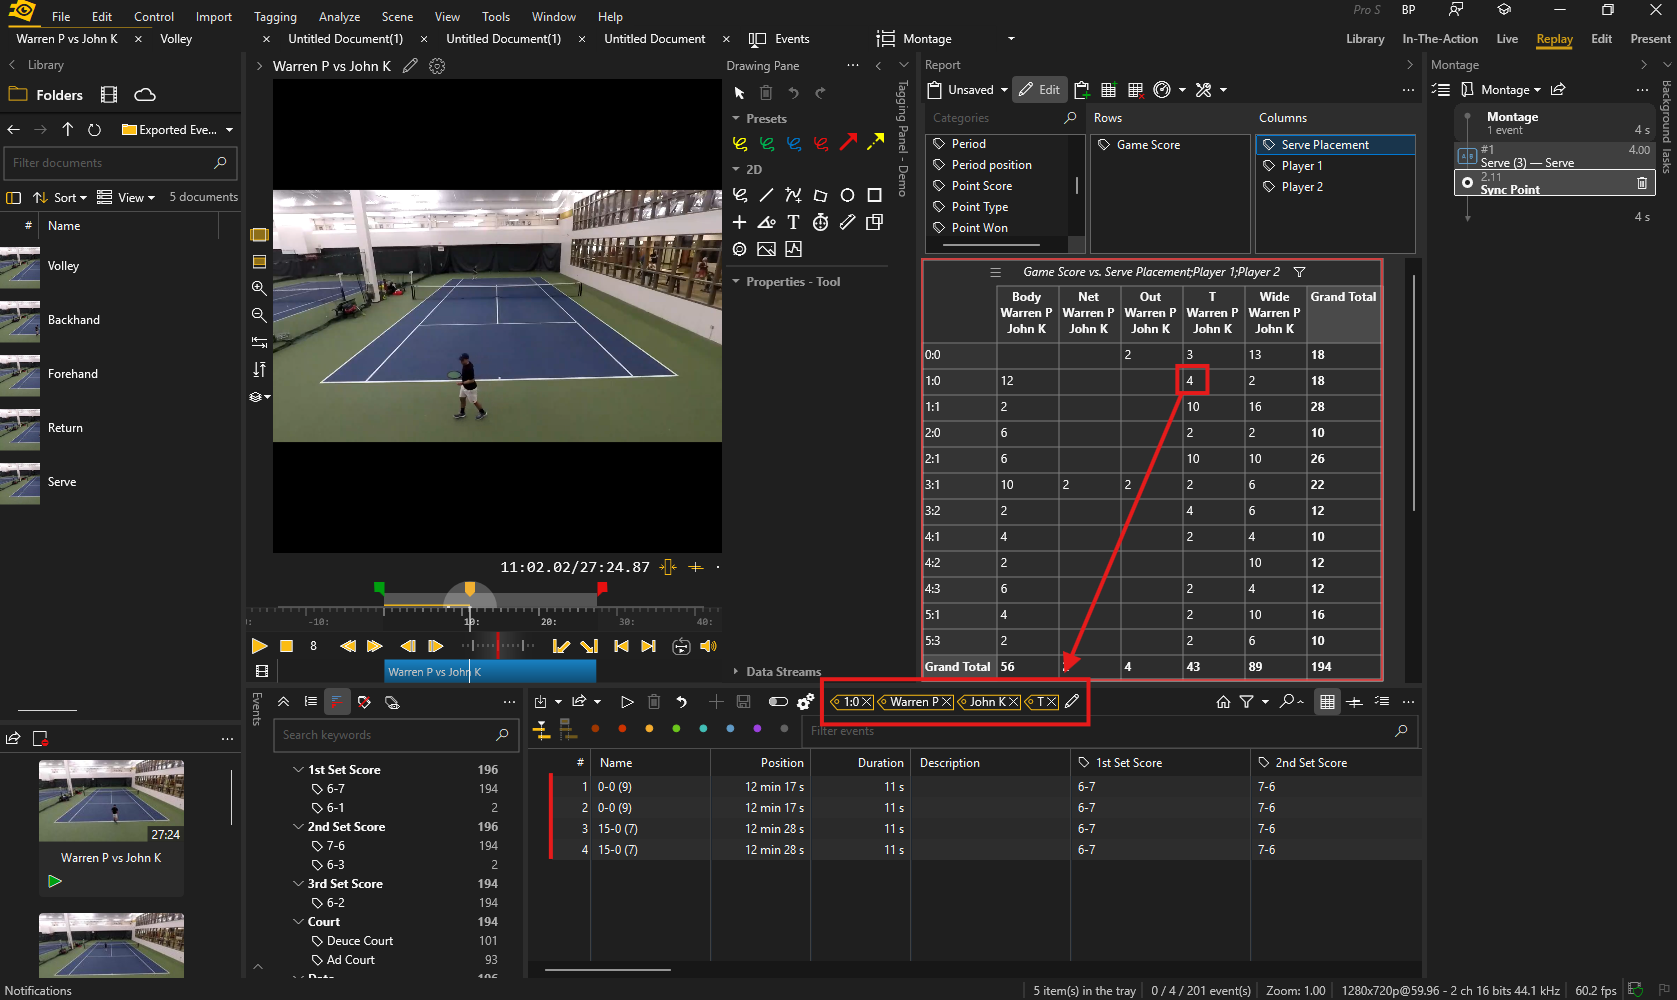
- Click a cell of a table or a segment of a chart. The Events pane lists the events counted there; you can play them from there.
- Right-click the cell or the segment to act on these events directly:
- Add Events to Montage > Current Montage, a recent montage, or Browse Montage...
- One item per action rule that has a button, for example Export Events: the rule runs on the events of the cell
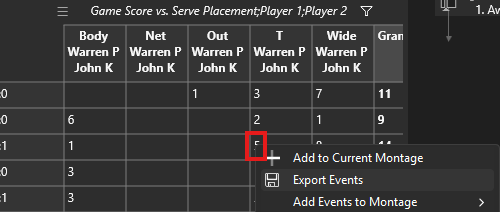
Result: the events behind the number are listed, ready to play or to use. For example, click the cell where a player and an outcome meet, check the events in the Events pane, then right-click the cell and choose Add Events to Montage > Current Montage to prepare the review.
3. Choose the colors and how totals are counted
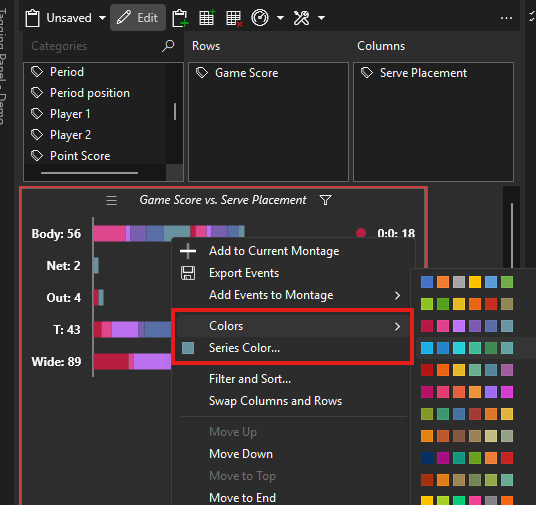
- For a chart: right-click a segment or a legend entry, then Series Color... and pick a color. Automatic restores the color of the palette.
- For a table: right-click the table, then Count Totals > Keyword Occurrences (the totals add up the cells) or Events (each event is counted once).
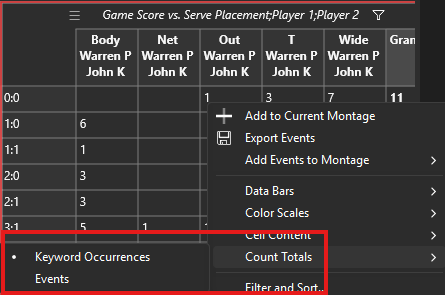
Result: the totals count what you need. For example, an event tagged with two keywords of the same category appears in two rows: with Keyword Occurrences, it counts twice in the total; with Events, it counts once.
4. Map positions with the Zone Map
The Zone Map view draws the positions tagged with a Zone Tool on the image of that tool.
- In the Report pane, select a view or click Add View.
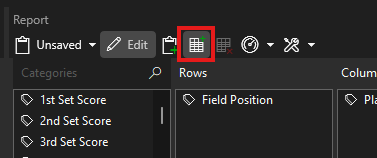
- Click View Type > Zone Map.
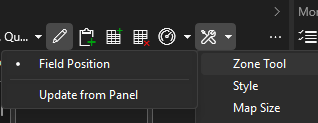
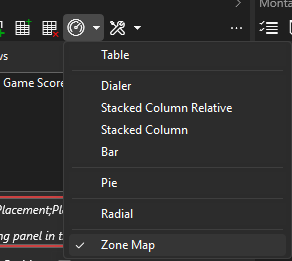 The view takes the first Zone Tool of the panel; to choose another one, click View Options > Zone Tool.
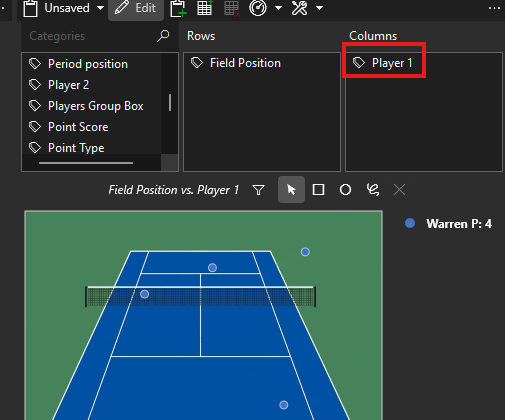
- To show one color per team or per player, click Edit and drag the category to Columns.
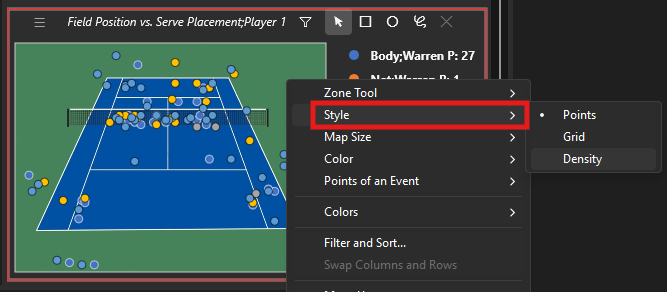
- In View Options, choose the Style:
- Points: one point per event
- Grid: the field cut into cells, colored by the number of events
- Density: a heat map
- If needed, adjust the map in View Options or with a right click on the map:
- Palette (Grid, Zones and Density styles): the color scale, from few to many events: Spectral (default), Hot, Inferno, Viridis, Single Hue or Contours. The top color always matches the highest count of the view.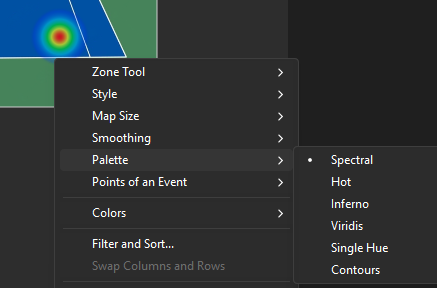 - Show Zones (on by default, when the Zone Tool has zones): outlines the zones of the tool over the map. Turn it off for a clearer map.
Result: the map shows where the actions took place. For example, with Columns set to Player, the Points style shows each player's actions in their own color, and the legend gives the number of events of each player that are on the map.
5. Select an area of the map
- Next to the view label of the Zone Map, choose Rectangle Selection, Ellipse Selection or Lasso Selection, then draw the shape on the map. Hold Shift to add to the selection, Ctrl to remove from it.
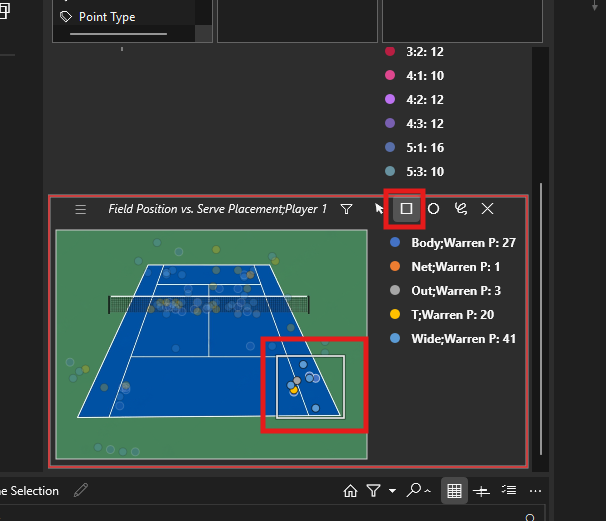
- Right-click inside the selection to add its events to a montage.
- To start again, click Clear Selection.
Result: the Events pane lists the events inside the shape, with a Zone Selection filter button.
Notes / Limitations
- Unchecked values are not counted. In Filter and Sort, the events of an unchecked value leave the view and its totals.
- Saved with the report. The filter and the order of a view are saved with the report.
- Positions only. The Zone Map shows only events with coordinates; events tagged without a position are left off the map.
- A copy of the Zone Tool. A Zone Map view keeps a copy of the Zone Tool, saved with the report. If you change the tool in the panel (image, field size, zones), click View Options > Zone Tool > Update from Panel.
Tips and best practices
- Combine Largest First and Show First to keep a view readable when a category has many values.
- A click on a point, a cell or a zone of the Zone Map with the Pointer also lists its events.
FAQ
Why is my Zone Map empty?
The events have no coordinates. The Zone Tool records positions only when it has a Coordinates Category (a tool without zones records them in its Category): set it in the Tagging Panel Editor, then tag the positions with the Zone Tool.
Why don't the totals match the sum of the rows?
An event tagged with two keywords of the same category appears in two rows. Right-click the table, then Count Totals: choose Keyword Occurrences to add up the cells, or Events to count each event once.
See also
Advanced Filtering — filtering events by keyword and saving filters.